Physical Address
304 North Cardinal St.
Dorchester Center, MA 02124
Physical Address
304 North Cardinal St.
Dorchester Center, MA 02124


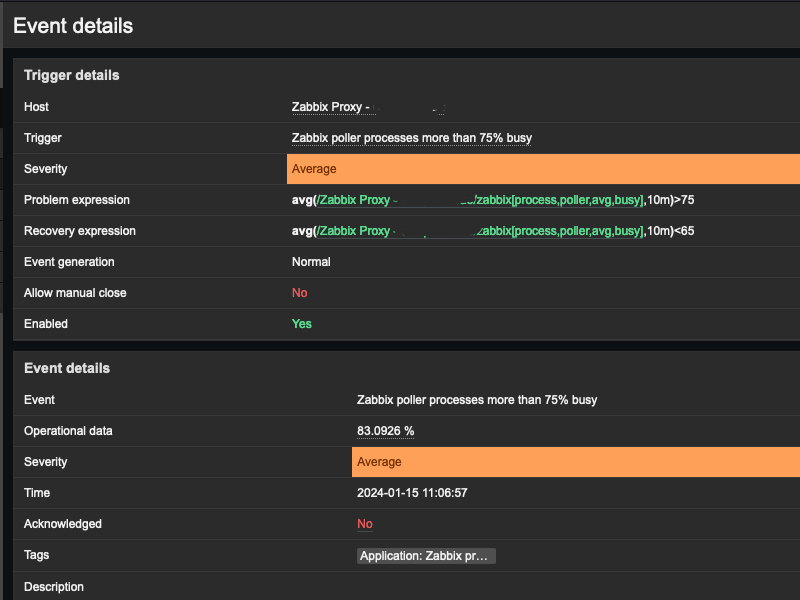
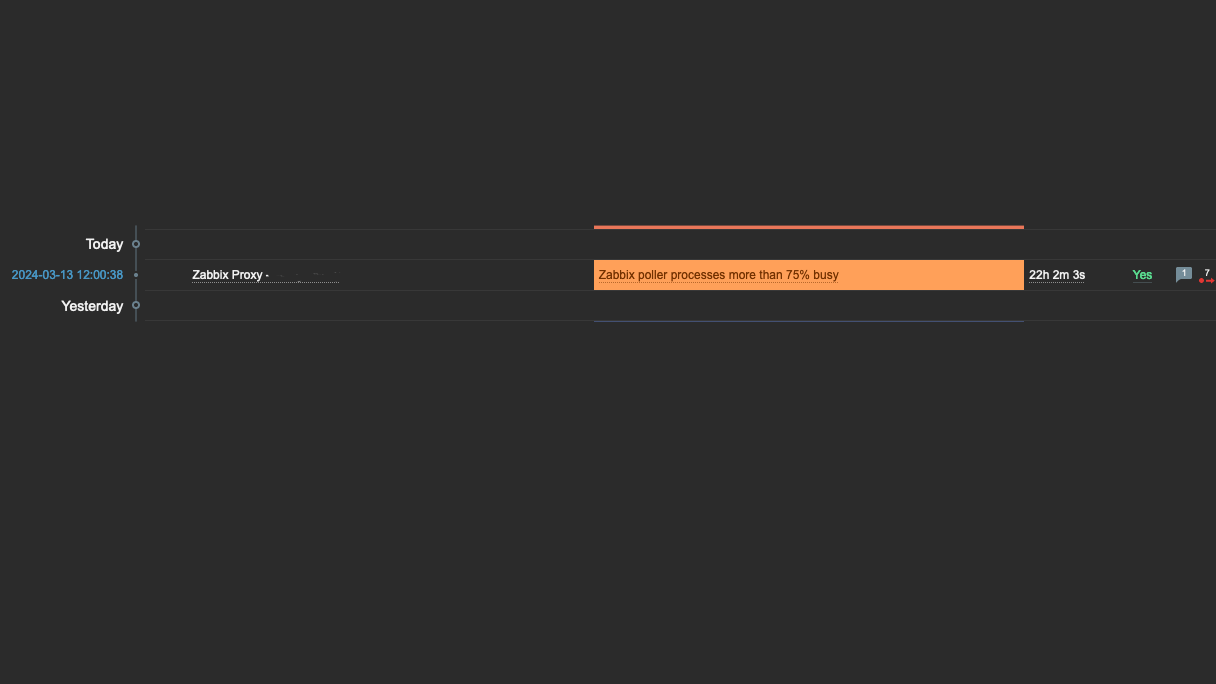
Alerts for “Zabbix poller processes more than 75% busy” and/or “Zabbix unreachable poller processes more than 75% busy” occur after situations where multiple Kubernetes nodes are born or die, resulting in significant workload for the pollers (Zabbix StartPollersUnreachable and StartPollers). However, they are not scaled to handle that operational load, leading to alerts and sometimes filling the Zabbix Proxy queues
Adjust the conf, changing the values of the Zabbix StartPollers and Zabbix StartPollersUnreachable fields.
Values depend on several issues, adjustments, tests and validations are necessary, and may vary depending on the environment.
Here is what was applied in our case:
fernando@ohnz-zabbix-server:/etc/zabbix#
fernando@ohnz-zabbix-server:/etc/zabbix# cat zabbix_server.conf  | grep StartPollers
### Option: StartPollers
StartPollers=25
### Option: StartPollersUnreachable
StartPollersUnreachable=10
fernando@ohnz-zabbix-server:/etc/zabbix#
After adjustment, it is necessary to restart the Zabbix service:
systemctl restart zabbix-serverOn the Proxy side, the configuration needs to be carried out in the Zabbix-Proxy Deployment in Kubernetes.
We have variables that are “understood” by Docker, which can be leveraged for use in env at the Kubernetes level, for example:
https://github.com/erickertz/zabbix-docker/blob/master/.env_srv
In our case, we adjust:
ZBX_STARTPOLLERSZBX_STARTPOLLERSUNREACHABLE
These two values are responsible for the functioning of the pollers and consequently the Zabbix poller processes.
Below is the zabbix-proxy Deployment configuration before/after:
FROM:
    spec:
      containers:
        - env:
            - name: ZBX_HOSTNAME
              value: zabbix-proxy-lab
            - name: ZBX_SERVER_HOST
              value: 33.121.2.89
            - name: ZBX_CACHESIZE
              value: 256M
            - name: ZBX_CONFIGFREQUENCY
              value: '60'
TO:
    spec:
      containers:
        - env:
            - name: ZBX_HOSTNAME
              value: zabbix-proxy-lab
            - name: ZBX_SERVER_HOST
              value: 33.121.2.89
            - name: ZBX_CACHESIZE
              value: 256M
            - name: ZBX_CONFIGFREQUENCY
              value: '60'
            - name: ZBX_STARTPOLLERS
              value: '25'
            - name: ZBX_STARTPOLLERSUNREACHABLE
              value: '10'
Validating, the settings were successfully applied, after adjustment in Deployment:
bash-5.1$ cd /etc/zabbix/
bash-5.1$ cat zabbix_proxy.conf | grep StartPollers
### Option: StartPollers
# StartPollers=5
StartPollers=25
### Option: StartPollersUnreachable
# StartPollersUnreachable=1
StartPollersUnreachable=10
bash-5.1$
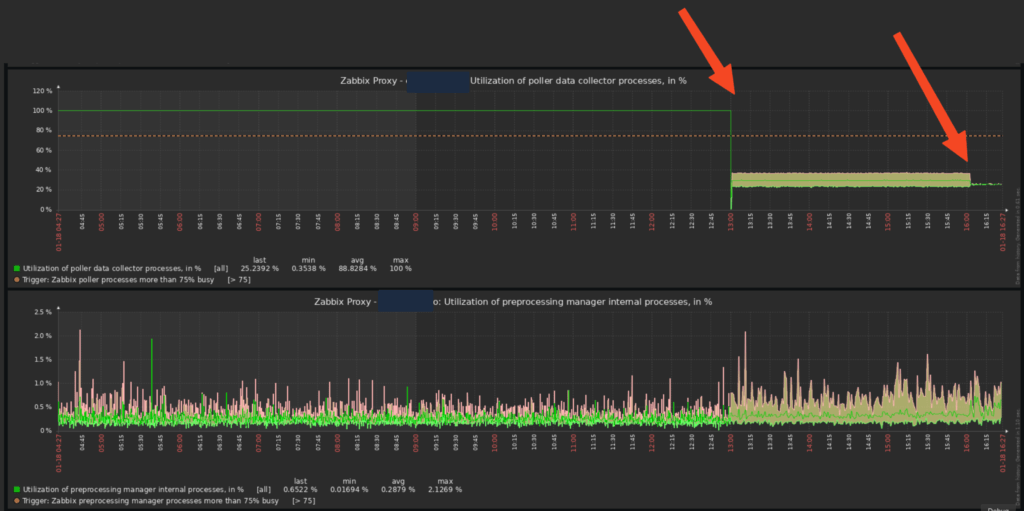
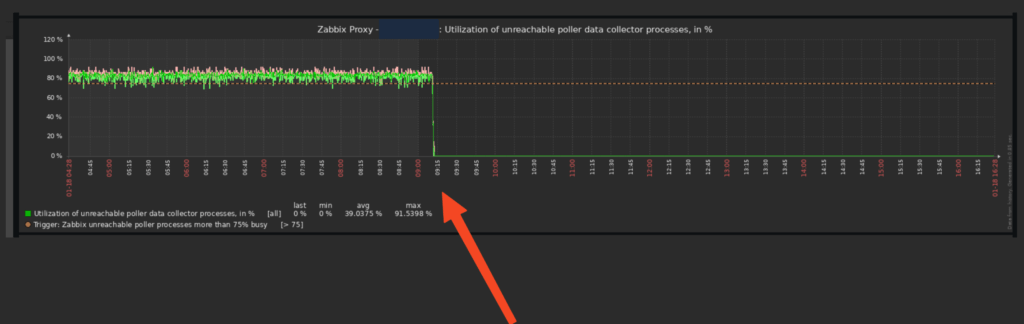
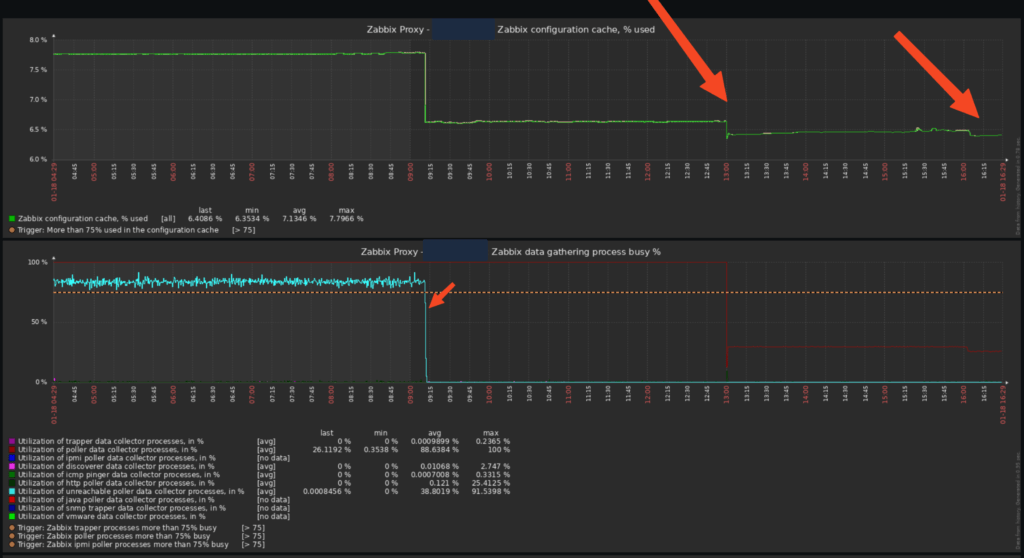
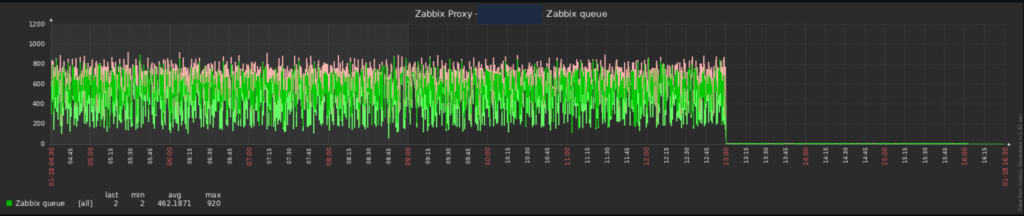
bash-5.1$ It is possible to check the improvements through the Zabbix graphs, in a very aggressive way, in addition to the alerts related to Zabbix poller processes more than 75% busy stopping:

This post seeks to bring some parameters that were increased to meet a specific scenario, it may be that additional adjustments and/or attempts/tests beyond what expected are necessary in your environment, depending on the particularities of your environment.
It is important to take care of the sizing of the machines involved (Zabbix Server, Zabbix Proxy, etc.), as when adjusting these parameters, there may be an increase in CPU, RAM, etc. consumption.
By carrying out all the steps mentioned, we will optimize our Zabbix Server + Zabbix Proxy in a good way, to avoid new occurrences of Zabbix poller processes more than 75% busy and screens like this:
I have been using Zabbix to monitor the health of several components of my Kubernetes clusters, where Zabbix has carried out very effective monitoring, covering several relevant items from different components.
On this page you can check the items and triggers covered in each template, there are several:
By browsing each tab, it is possible to check the number of items/triggers for each of them.
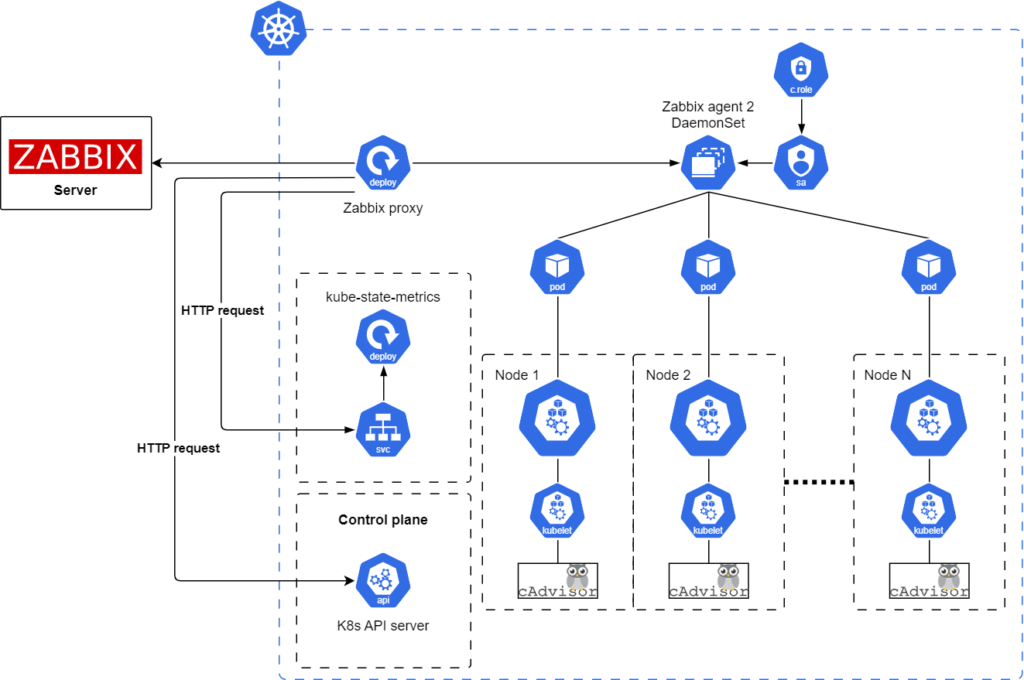
This is the reference architecture of the monitoring framework for Kubernetes clusters using Zabbix:
Previously, I used some tools to monitor the health of Kubernetes clusters, such as:
However, they were unable to bring so many inputs and alert me in advance in different scenarios about problems that were occurring in my EKS clusters.
I reinforce the words of this post:
Why Choose Zabbix to Monitor Kubernetes?
Before choosing Zabbix as a Kubernetes monitoring tool, we asked ourselves, “why would we choose to use Zabbix rather than Prometheus, Grafana, and alertmanager?” After all, they have become the standard monitoring tools in the cloud ecosystem. We decided that our minimum criteria for Zabbix would be that it was just as effective as Prometheus for monitoring both Kubernetes and cloud-native applications.
Through our discovery process, we concluded that Zabbix meets (and exceeds) this minimum requirement. Zabbix provides similar metrics and triggers as Prometheus, alert manager, and Grafana for Kubernetes, as they both use the same backend tools to do this. However, Zabbix can do this in one product while still maintaining flexibility and allowing you to monitor pretty much anything you can write code to collect. Regarding application monitoring, Zabbix can transform Prometheus metrics fed to it by Prometheus exporters and endpoints. In addition, because Zabbix can make calls to any HTTP endpoint, it can monitor applications that do not have a dedicated Prometheus endpoint, unlike Prometheus.
Michaela DeForest – https://blog.zabbix.com/monitoring-kubernetes-with-zabbix/25055/
If you are curious about deploying Zabbix to monitor Kubernetes clusters, here are some important materials in the next section.
Did you like the article? Don’t forget to sign up for our newsletter to receive the latest news and tips about DevOps directly to your email, go to our home page and subscribe to the “Receive news by email” block. Also, read our other content on Observability to continue improving your DevOps/SRE skills.


