Physical Address
304 North Cardinal St.
Dorchester Center, MA 02124
Creating Kubernetes clusters on AWS can be complicated for beginners, since EKS has many resources and dependencies, and it can be complex and time-consuming to get a fully functional cluster, but with EKS Blueprint, this process becomes simpler and more efficient. In this article I’ll explain in great detail how to set up Kubernetes clusters using EKS Blueprint via Terraform, integrate tools such as Grafana, AlertManager and Prometheus, and show you the benefits of this approach. If you want to learn how to set up Kubernetes clusters very easily and simply, this material will help you a lot!
In addition, the Makefile used in the labs offers simple commands for operations such as apply, destroy, and port-forward, further optimizing the process.
Tópicos
EKS Blueprint is a framework developed by AWS that allows you to create Amazon EKS clusters in a standardized and repeatable way using Terraform. It offers:
It allows you to provision and configure Amazon EKS clusters quickly and efficiently. It abstracts the complexity of creating Kubernetes clusters on AWS, bringing a set of pre-configured and reusable templates, and providing a simple and consistent way to configure and manage your environments.
To carry out the procedures, we’re going to use the Terraform manifests in my repository:
As you can see, we have 2 folders called 001-eks-blueprint and 002-eks-blueprint-com-graphana, containing respectively:
Before proceeding, make sure you have all the requirements below:
We’re going to clone the project repository, containing the labs and all the manifests we need.
To do this, create a folder or choose an existing folder and run the command below to make the clone and then access the created directory:
git clone https://github.com/fernandomullerjr/cluster-eks-via-blueprint.git
cd cluster-eks-via-blueprint
First, let’s go through the procedures for uploading an EKS without the extra addons. To do this, go to the 001-eks-blueprint project folder:
cd 001-eks-blueprintThe initial configuration uses locals.tf files to define essential variables such as region, cluster name, cluster version and account id. Here’s an example:
locals {

  #name            = basename(path.cwd)
  name            = "eks-lab"
  region          = data.aws_region.current.name
  cluster_version = "1.30"

  account_id          = "312925778543"
  username_1          = "fernando"
  username_2          = "fernando-devops"

  vpc_cidr = "10.0.0.0/16"
  azs      = slice(data.aws_availability_zones.available.names, 0, 3)

  node_group_name = "managed-ondemand"

  tags = {
    Blueprint  = local.name
    GithubRepo = "github.com/aws-ia/terraform-aws-eks-blueprints"
  }
}
The fields must be adjusted:
Other fields can only be customized if personalization is required.
This project uses a Makefile(click here to learn how a Makefile works) to manage the creation and destruction of Terraform resources in an organized, step-by-step manner. This approach reduces the risk of problems related to dependencies between modules and simplifies the execution of the most common commands, ensuring a more efficient and reliable workflow.
To facilitate monitoring, the terminal displays messages in different colors to indicate the progress of operations. Informative, success and warning messages are highlighted, providing greater clarity for the user and helping to quickly identify the status of each stage of the process.
Common commands that he makes easy to execute:
# Criação dos recursos (apply)
apply: apply-vpc apply-eks apply-all
# Destruição dos recursos (destroy)
destroy: destroy-eks destroy-vpc destroy-all
As we are already at the root of project 001, all we have to do is perform the first terraform init and execute the make apply command, if you are already logged into AWS correctly, and wait for the magic to happen:
terraform init
make apply
The creation of Terraform resources in this project follows a structured flow in three main stages, ensuring greater organization and control.
Expected result:
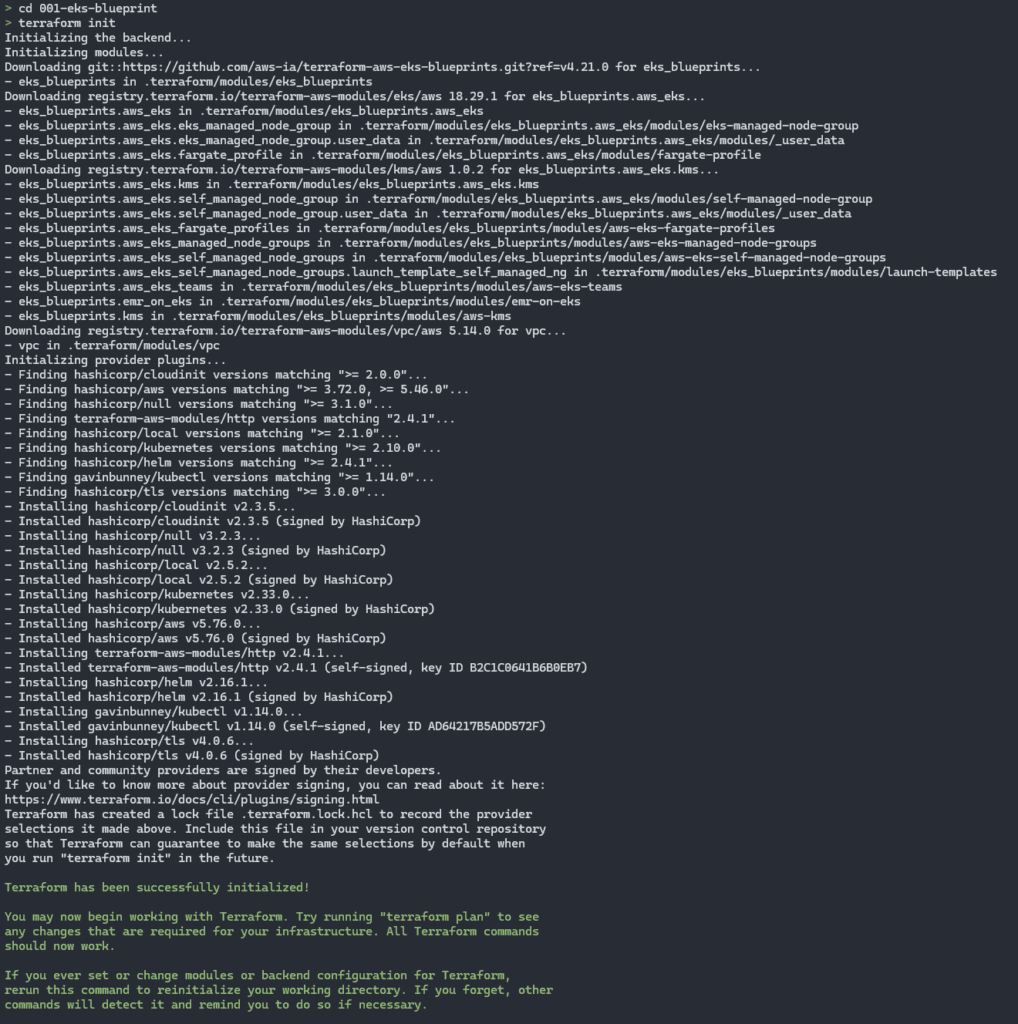
Having finished terraform init, it now starts creating resources via Terraform with make apply:
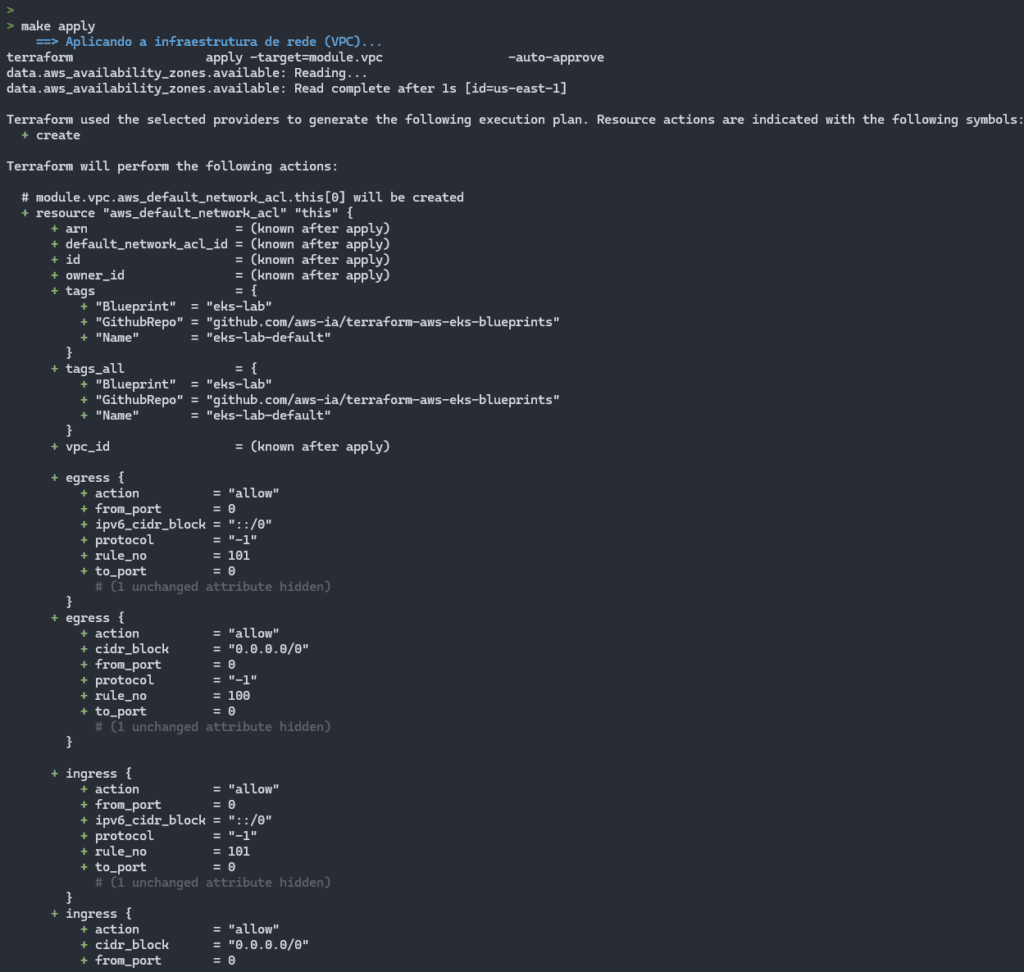
With each module applied, it brings up messages in green or blue, indicating the stage that is taking place:
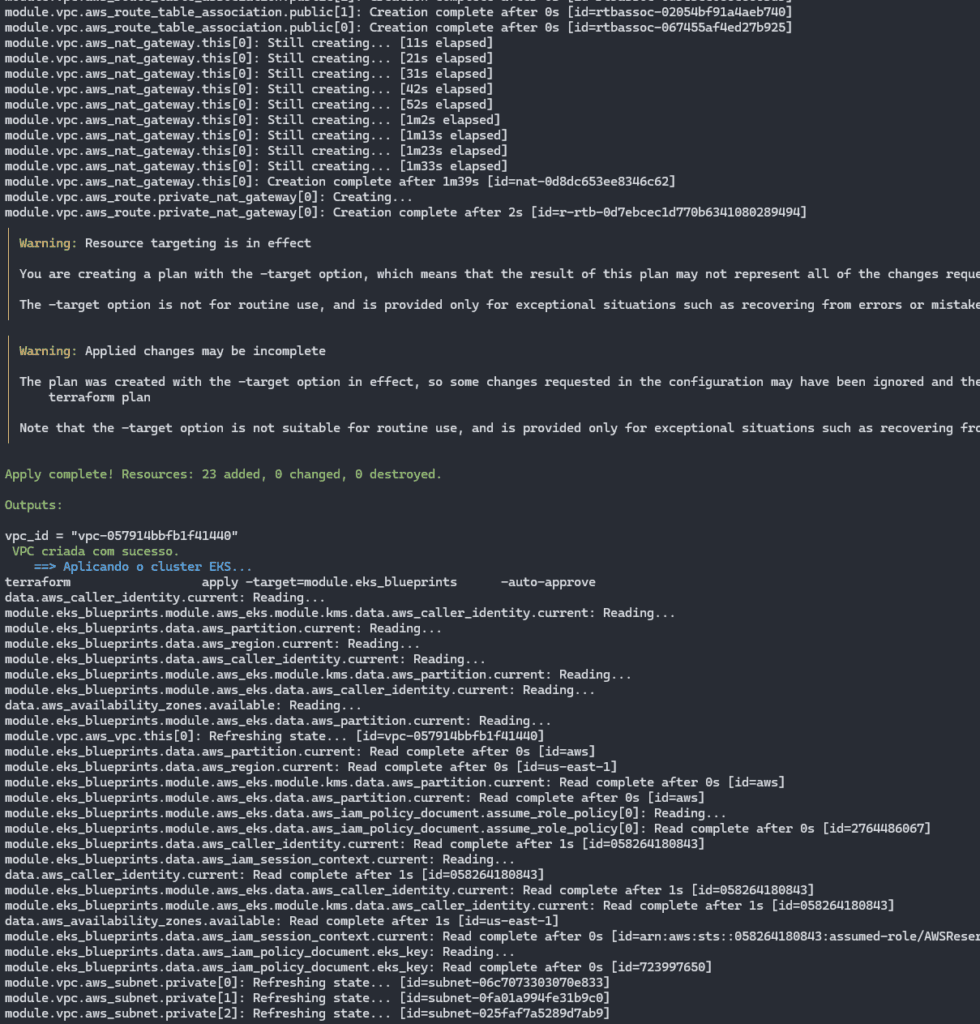
In the image above, finishing the VPC creation stage and all the related structure.
Finishing the creation of the EKS cluster and moving on to the application of the other resources:
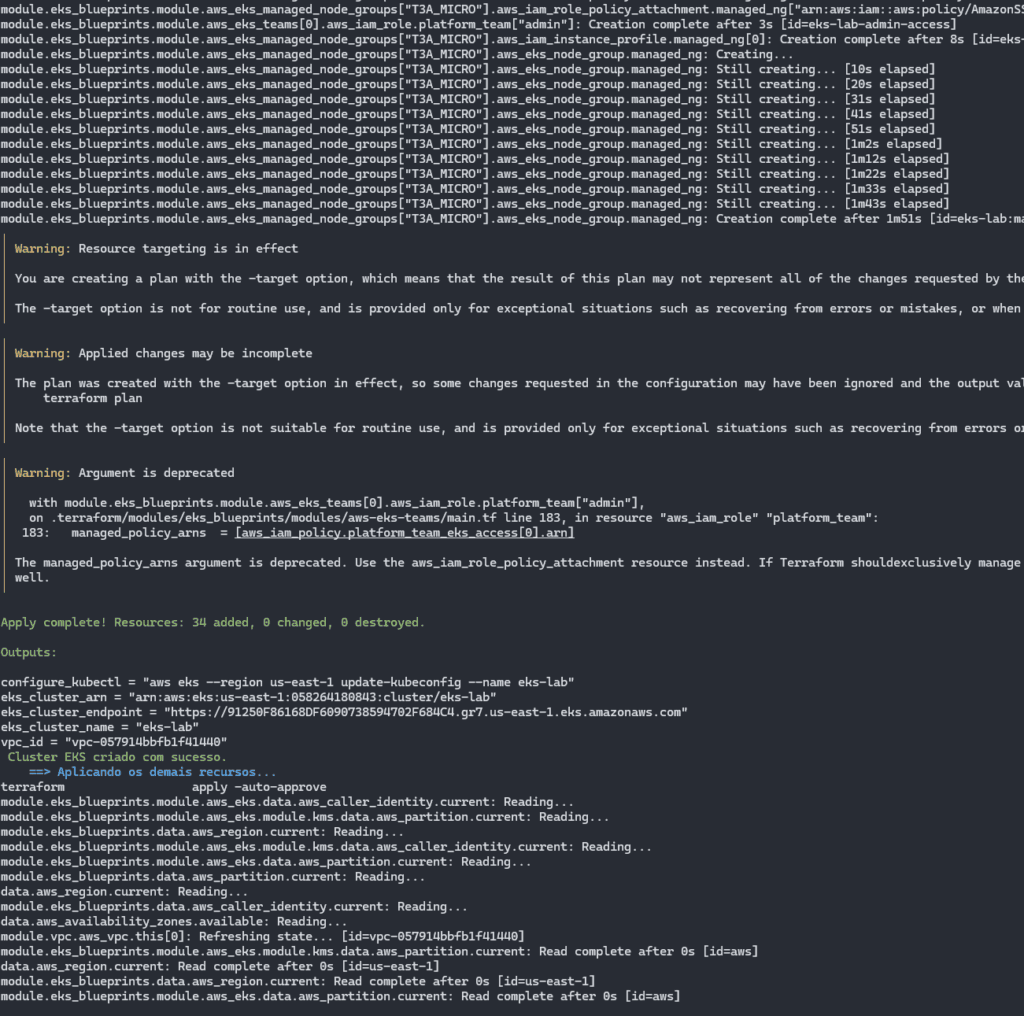
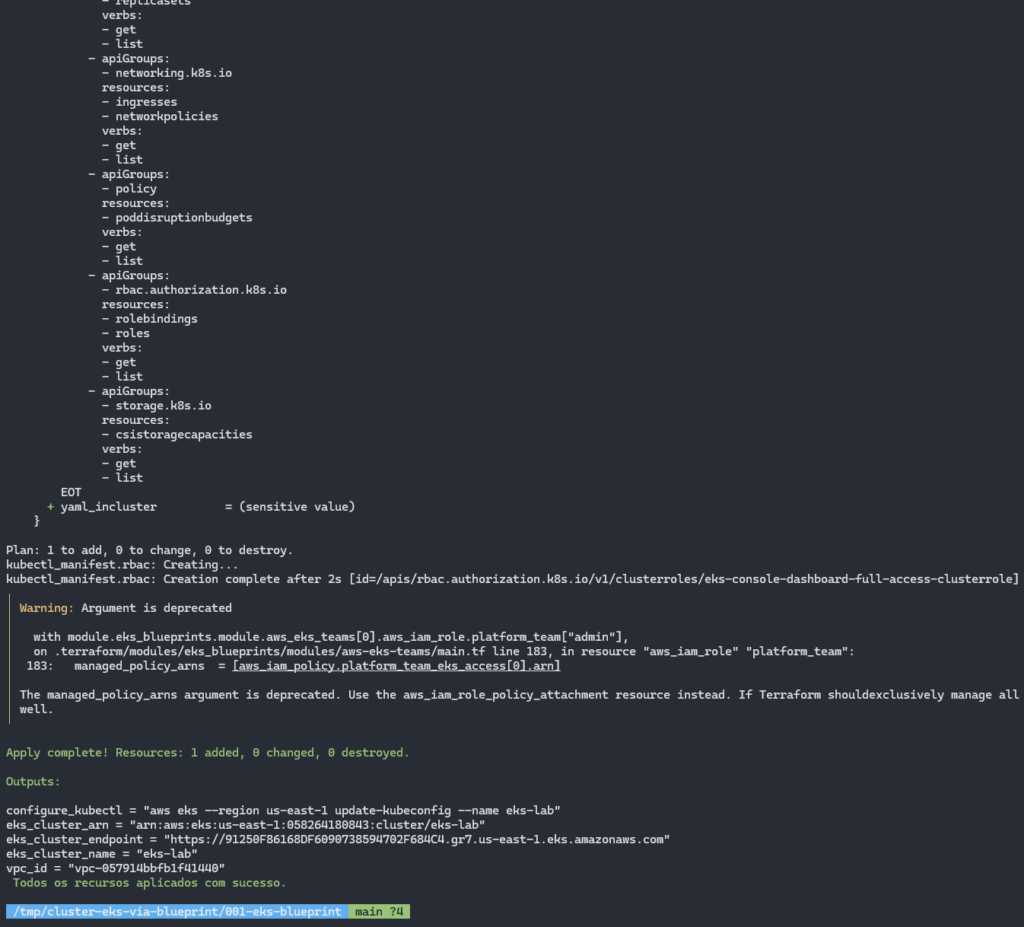
At the end of the process, you should see a screen like this:
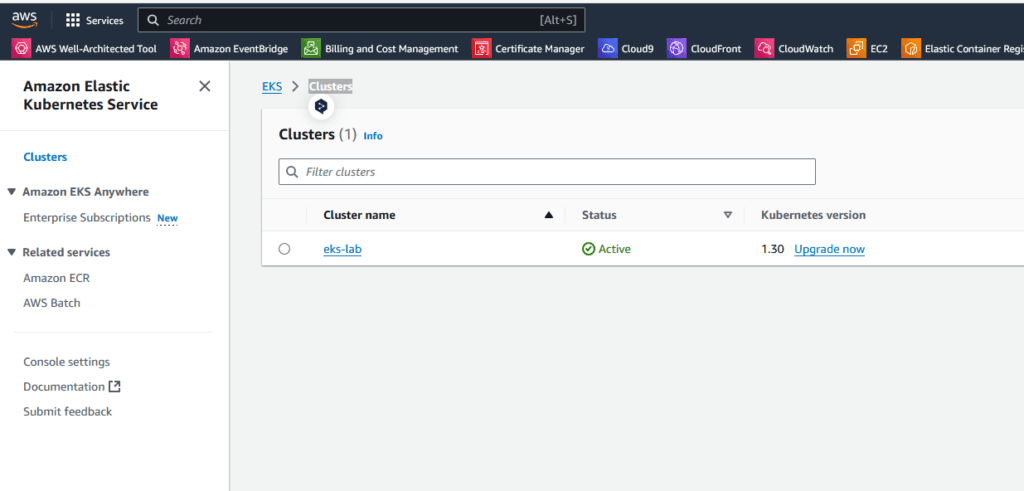
Our cluster is already accessible via the console on AWS:
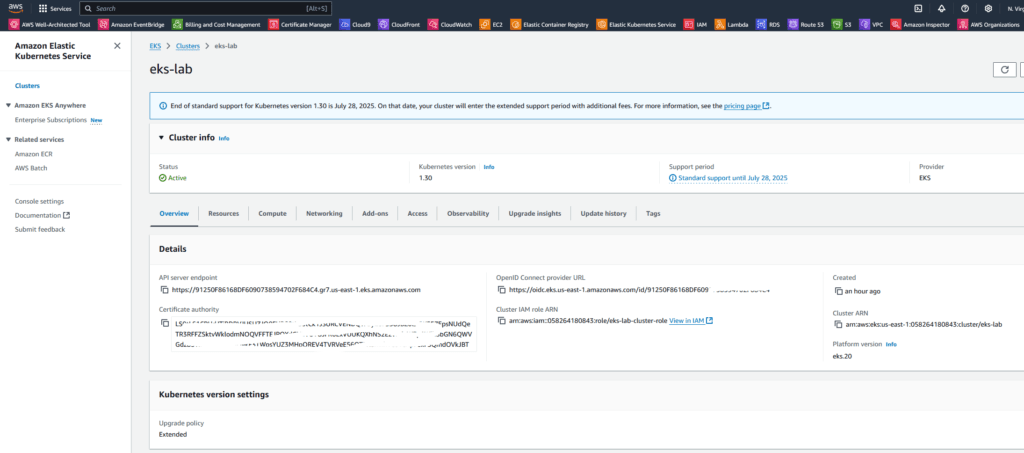
Once all the resources have been successfully provisioned, the following command can be used to update kubeconfig on your local machine and allow you to interact with your EKS cluster using kubectl.
aws eks --region <REGION> update-kubeconfig --name <CLUSTER_NAME> --alias <CLUSTER_NAME>In the output of make apply, at the end it brings up some outputs, one of which is configure_kubectl, containing an aws command for adjusting kubeconfig, already set to the name of the cluster we created. In my case, it looked like this:
aws eks --region us-east-1 update-kubeconfig --name eks-labWith this, we can now use direct commands in our EKS cluster:
kubectl get nodes
kubectl get pods -A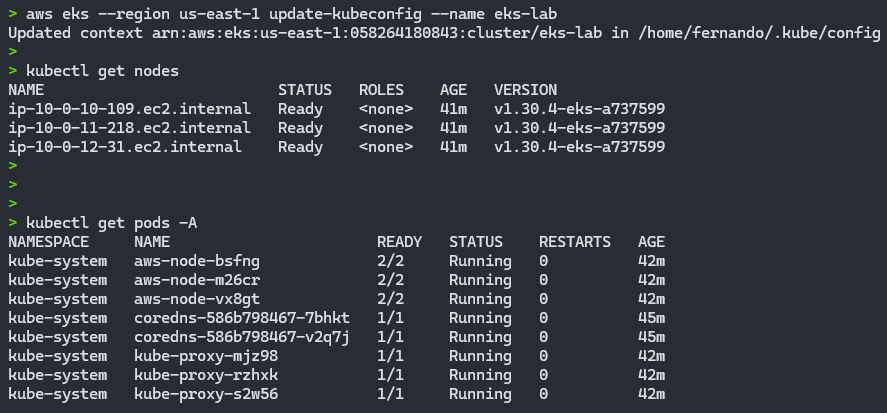
With this, we have a fully operational and provisioned EKS cluster with practically 1 command.
To destroy the EKS cluster and remove it and all the resources that are created with it, just run the make destroy command:
make destroyIn the project folder, we have 2 files containing details of the existing make commands and the terraform commands under the hood:
Both appy and destroy are carried out in stages, according to the details contained in each of the above materials.
Result after running make destroy:
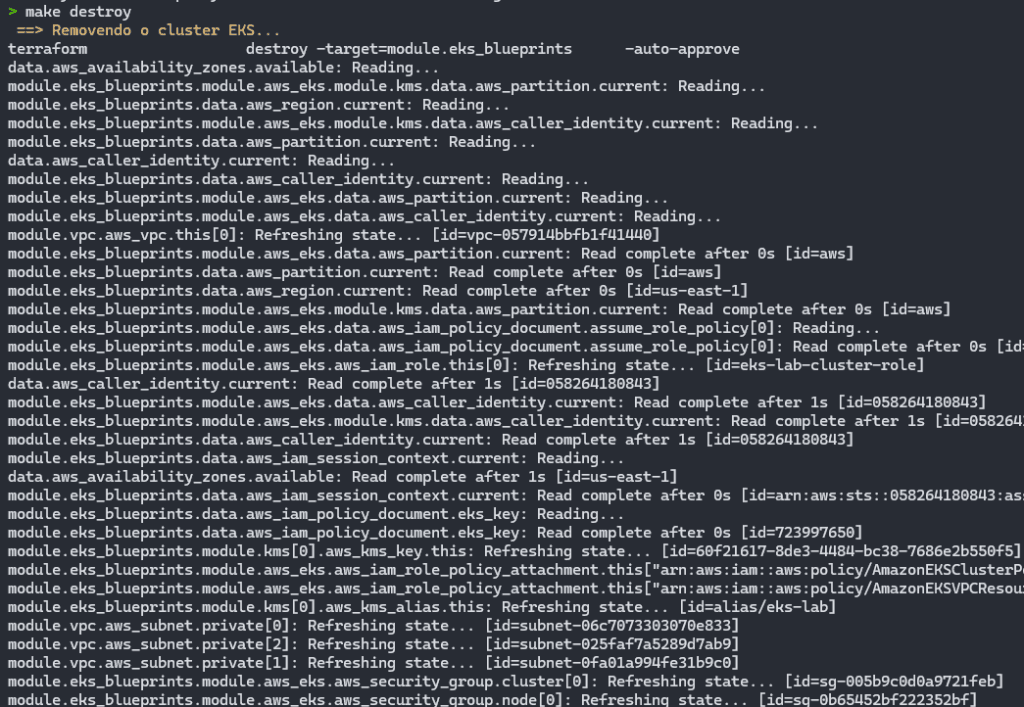
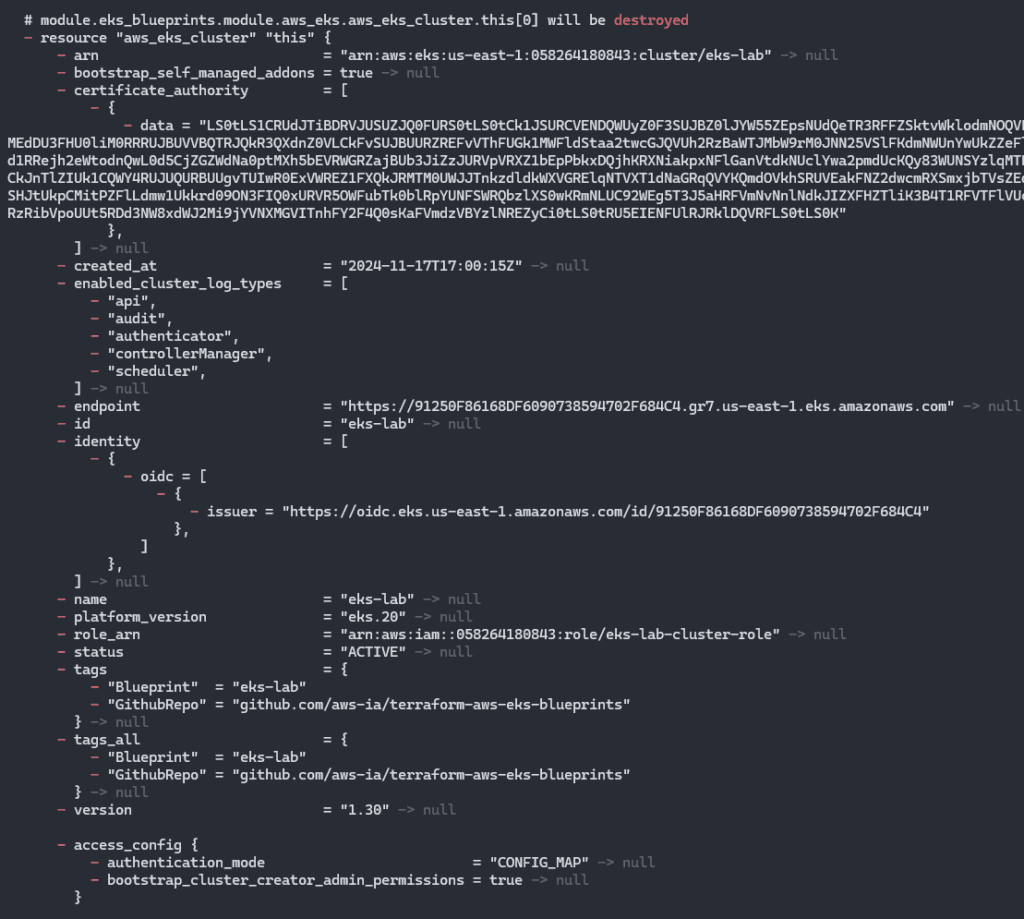
It starts by removing the EKS cluster and its nodes.
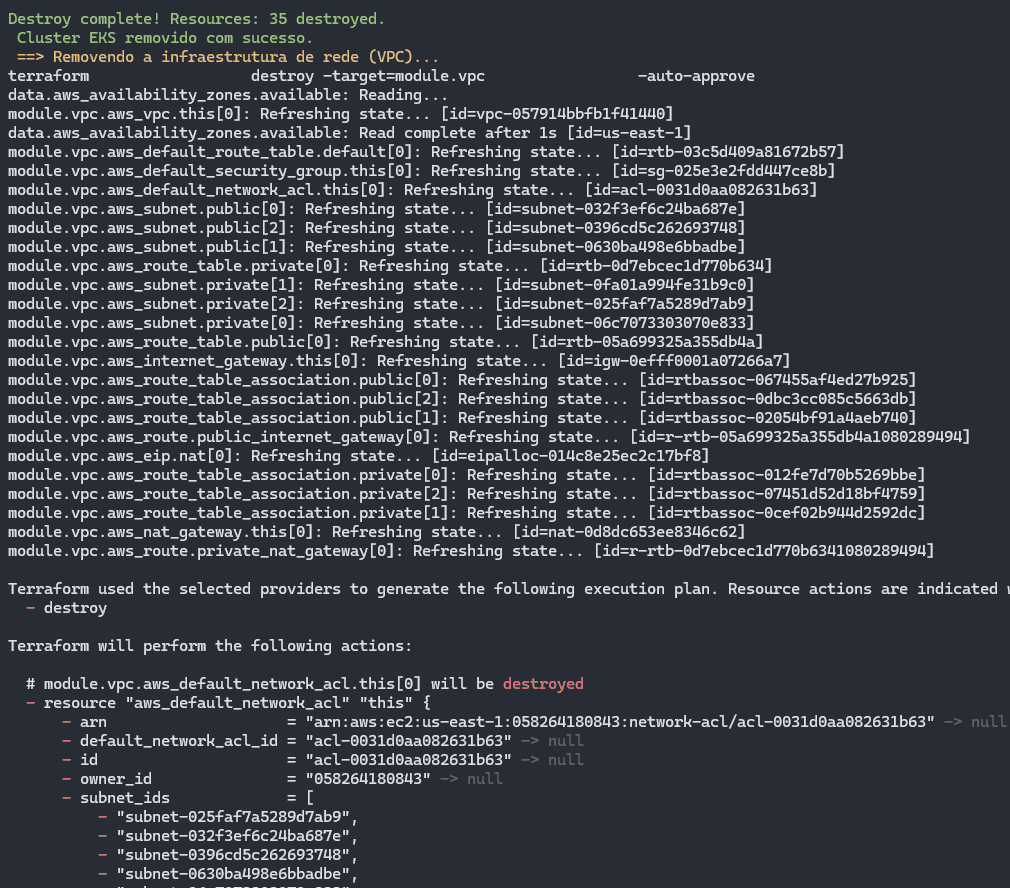
Once the cluster has been destroyed, the VPC and its associated resources are removed:
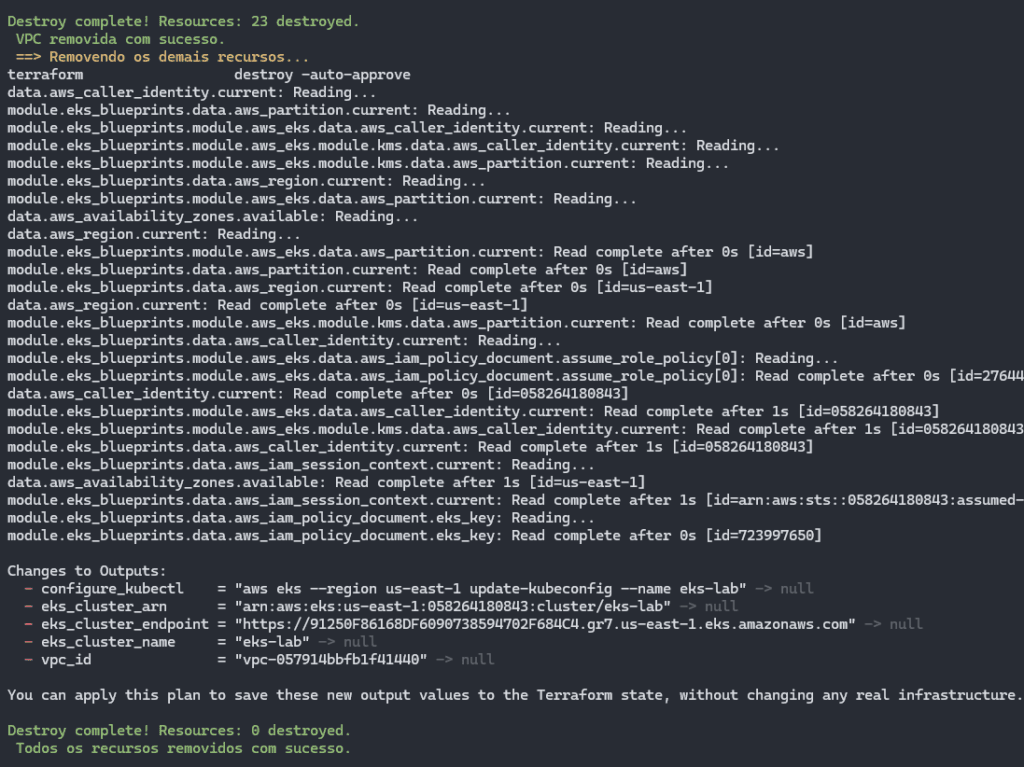
Then the removal of other resources begins, in case any other dependencies have been generated:
The destruction of Terraform resources is carried out in an orderly fashion, inverse to creation, to avoid conflicts between dependencies.
The process begins by removing the Kubernetes cluster in EKS, ensuring that the associated services and workloads are shut down correctly.
The network infrastructure (VPC) is then dismantled, freeing up the allocated resources.
Finally, the other additional resources are eliminated, completing the cleaning of the environment in a systematic and efficient manner.
In addition to the project we used in the previous steps, there is a folder called 002-eks-blueprint-com-grafana, where we have Project 002 containing the same EKS Blueprint, but now adding the kubernetes_addons module, containing some resources that can help, such as the AWS Load Balancer Controller and EBS Driver, as well as the Grafana stack with Prometheus and extra Dashboards.
This project uses Terraform to create an EKS Cluster based on the EKS Blueprint, ensuring an efficient and standardized implementation. The configuration includes the necessary RBAC structure, applying the appropriate manifests to manage permissions and access within the cluster. In addition, two users are configured, one with root privileges and the other as an ordinary user, both as administrators. This is done via the “Teams” feature, which simplifies access control to the cluster.
The kube-prometheus-stack is installed automatically, covering essential tools such as Prometheus, Grafana, AlertManager and Grafana Dashboards. Several useful dashboards are added to Grafana, offering a comprehensive view for monitoring and managing the Kubernetes cluster. These features optimize administration and improve visibility into the performance and health of the environment.
To start creating the EKS cluster with the Grafana Stack, access the 002-eks-blueprint-com-grafana folder from the root of the repository:
cd 002-eks-blueprint-com-grafanaEdit the locals.tf file as necessary:
locals {

  #name            = basename(path.cwd)
  name            = "eks-lab"
  region          = data.aws_region.current.name
  cluster_version = "1.30"

  account_id = "552925778543"
  username_1 = "fernando"
  username_2 = "fernando-devops"

  vpc_cidr = "10.0.0.0/16"
  azs      = slice(data.aws_availability_zones.available.names, 0, 3)

  node_group_name   = "managed-ondemand"
  node_group_name_2 = "managed-ondemand-2"

  tags = {
    Blueprint  = local.name
    GithubRepo = "github.com/aws-ia/terraform-aws-eks-blueprints"
  }
}
Then run terraform init and make apply, after adjusting the locals.tf file:
terraform init
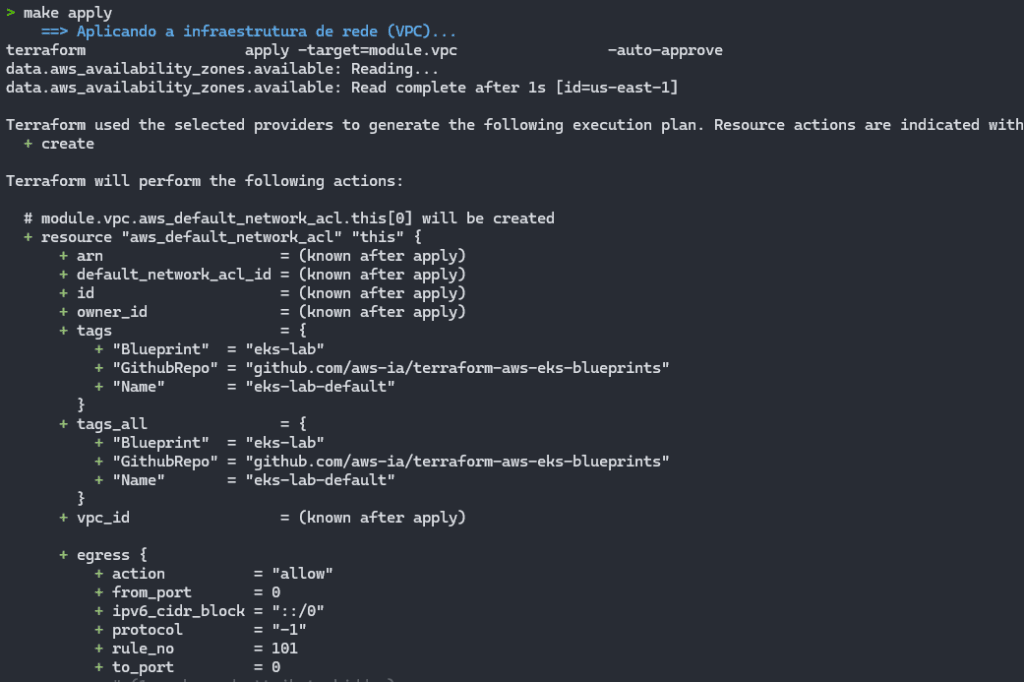
make apply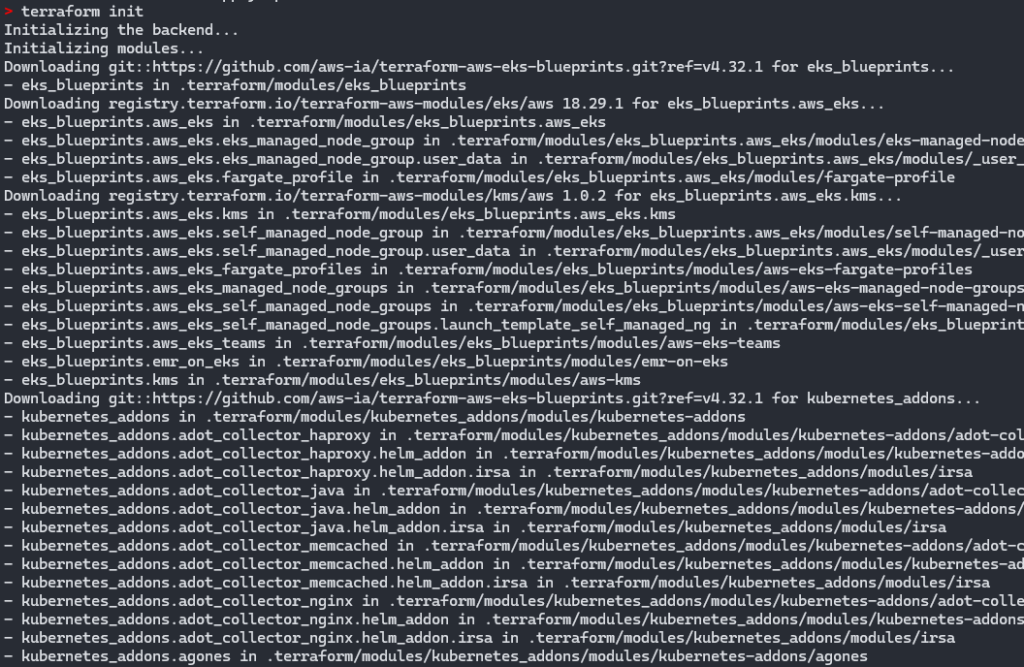
The creation of the VPC and all the associated resources will begin:
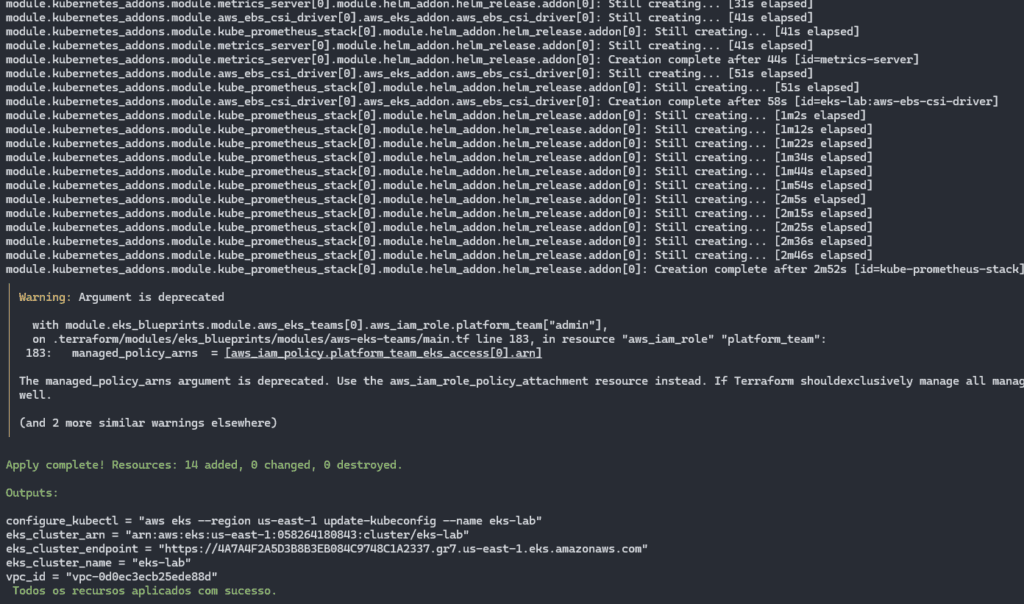
It will create the EKS cluster and will already create all the addons, as well as configuring the Grafana Stack, Prometheus and the additional dashboards:
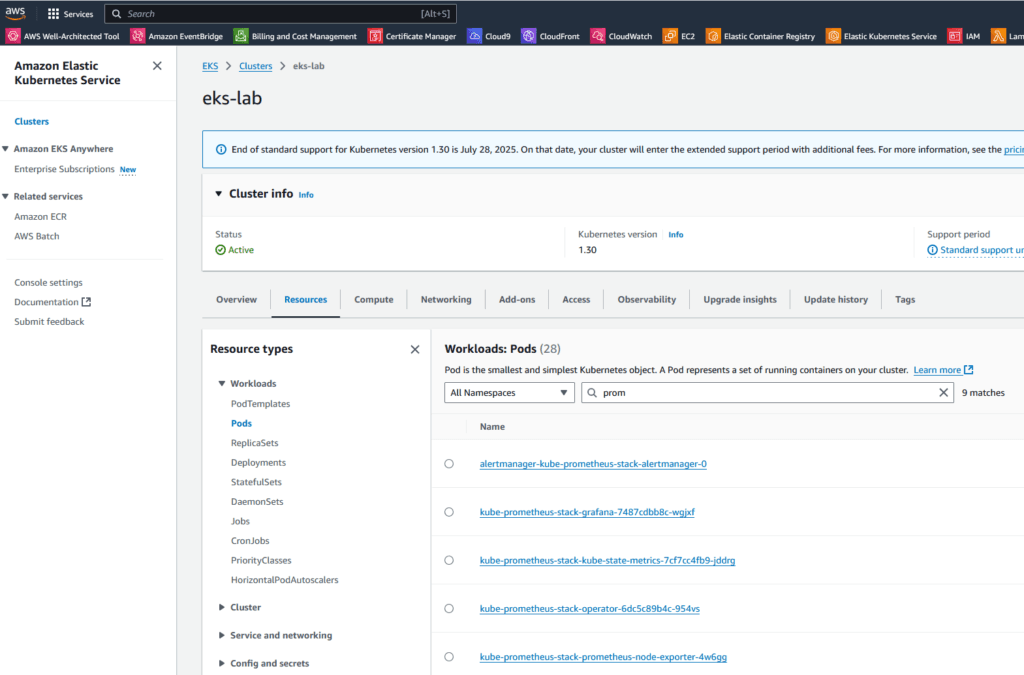
By authenticating to the EKS cluster and checking the running Pods, we can validate that all the Pods are working as expected:
aws eks --region us-east-1 update-kubeconfig --name eks-lab
kubectl get pods -A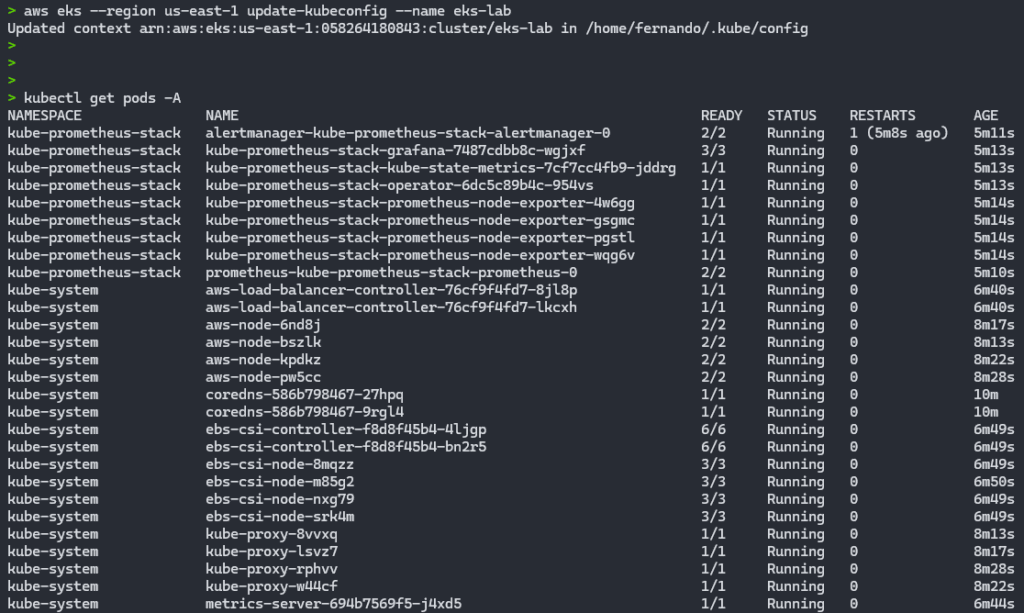
Through the AWS console, we can view our cluster and the resources that are part of it:
The make grafana command simplifies the process of running port-forward to access the Grafana interface via a browser. With just this command, the port mapping is done automatically, allowing you to view Grafana’s dashboards quickly and conveniently.

After executing the command, Grafana will be available at http://localhost:8080.
If you are using a virtual machine, WSL or Docker container, it is important to check the corresponding IP address to access Grafana from your host machine. This approach makes access more direct, making it easier to administer and monitor the cluster.
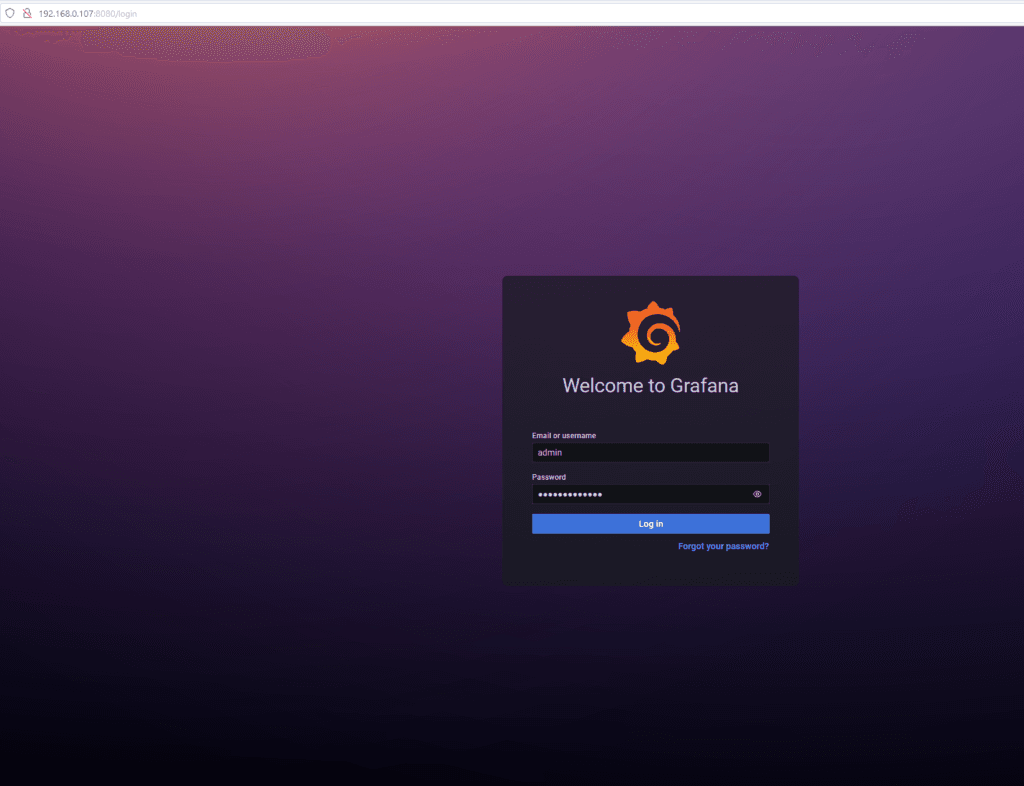
By default, this Grafana comes with the following username and password:
admin
prom-operator
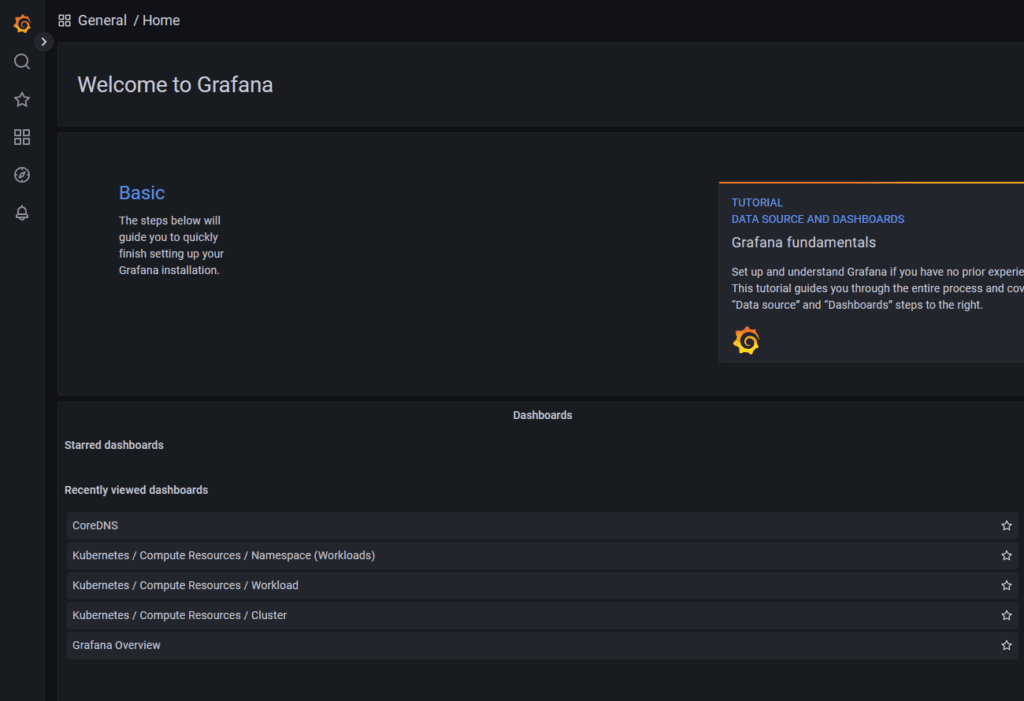
After entering your username and password, the Grafana home screen is displayed:
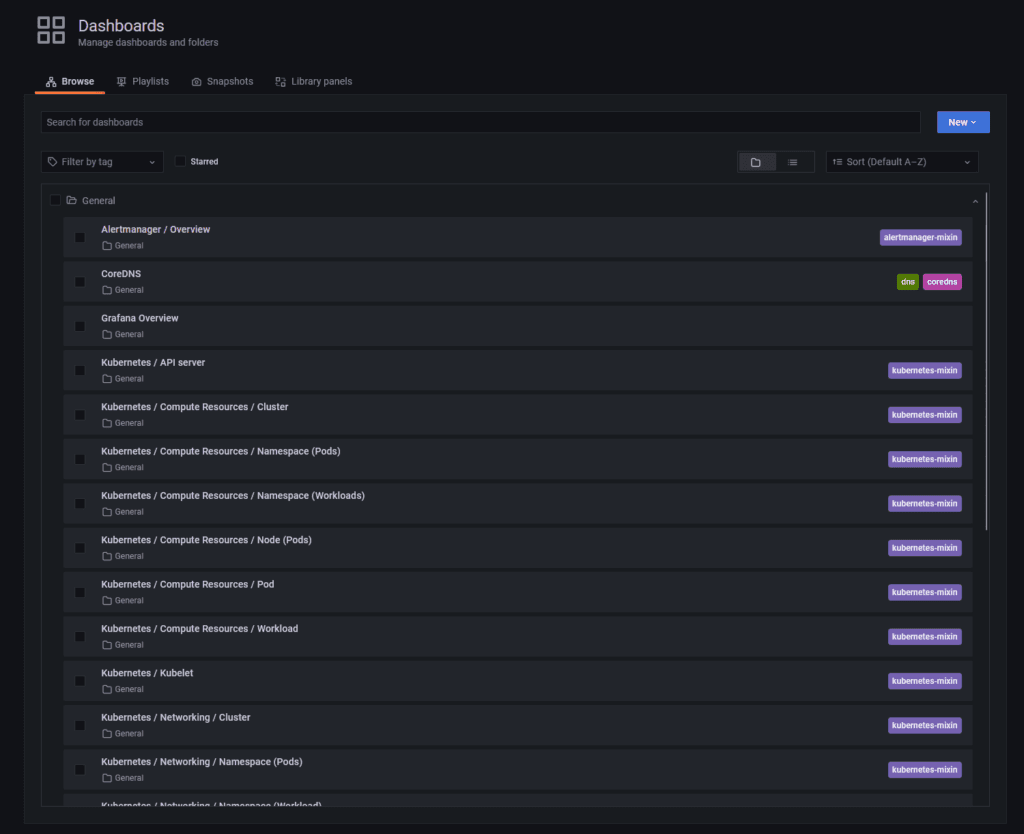
By accessing the menu on the left and going to Dashboards, we can see that the extra dashboards have been successfully loaded:
Accessing the”Kubernetes / Compute Resources / Cluster” dashboard:
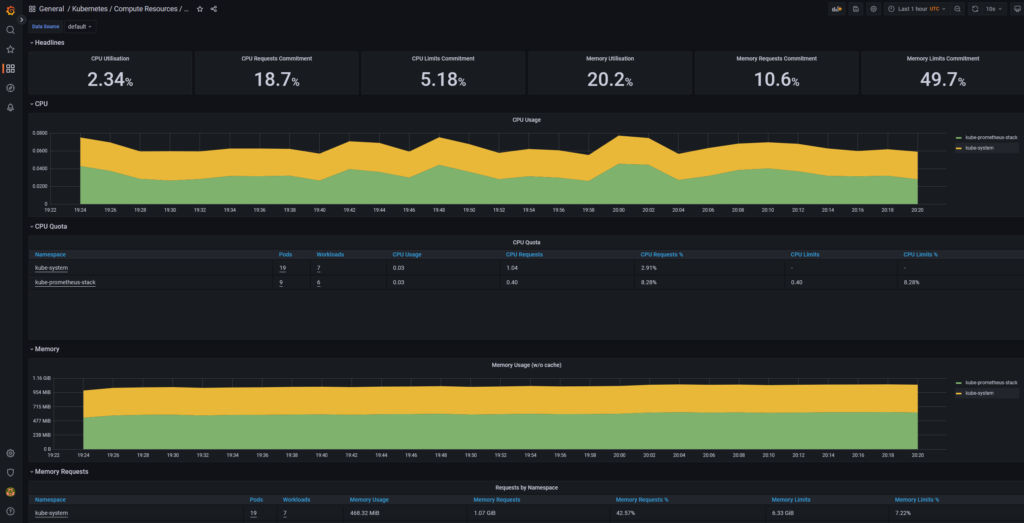
The make prometheus command makes it easy to run port-forward to access the Prometheus interface directly in the browser. With this command, the port mapping is configured automatically, allowing you to view and manage metrics quickly and efficiently.
make prometheus
After execution, Prometheus will be available at http://localhost:9191, if you are using a virtual machine, WSL or Docker container, it is essential to identify the correct IP address to access the application from the host machine. :
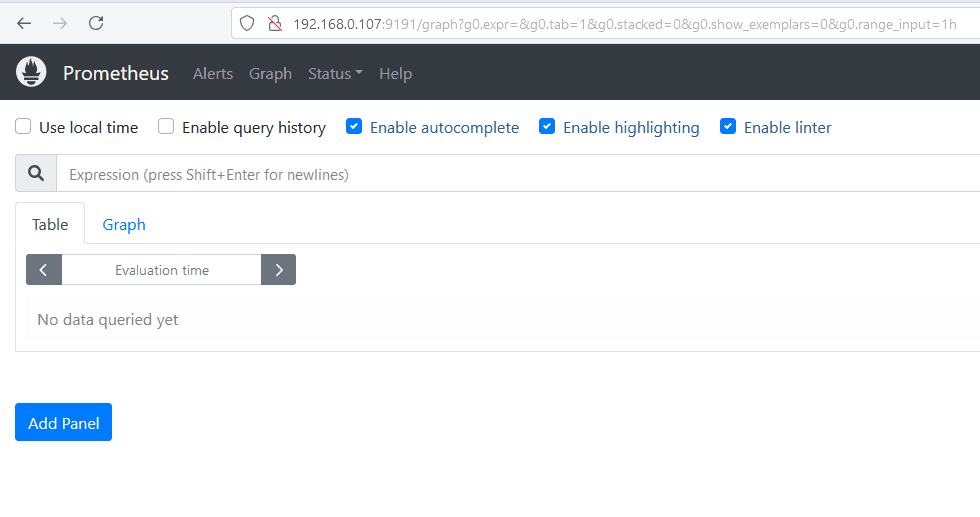
Running a query to validate that Prometheus is able to retrieve the information from our EKS cluster:
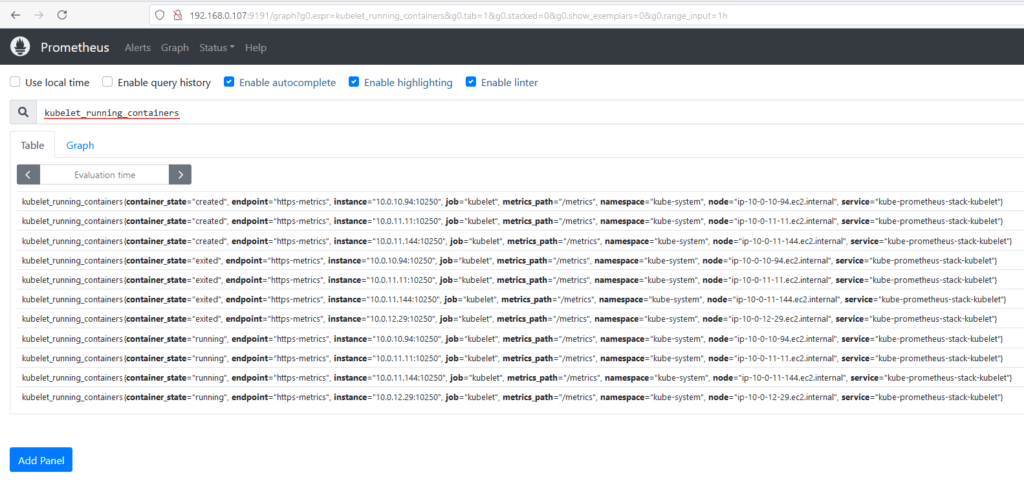
This process simplifies monitoring and guarantees quick access to the information collected by Prometheus.
Addons are extensions that can be added to a Kubernetes cluster to provide additional functionality. EKS Blueprint provides support for addons such as Cluster Autoscaler and CoreDNS.
After following the steps in Project 002 and uploading the EKS cluster with the entire Grafana stack and other add-ons, we can see via the console that EBS CSI DRIVER exists in the Add-ons tab:
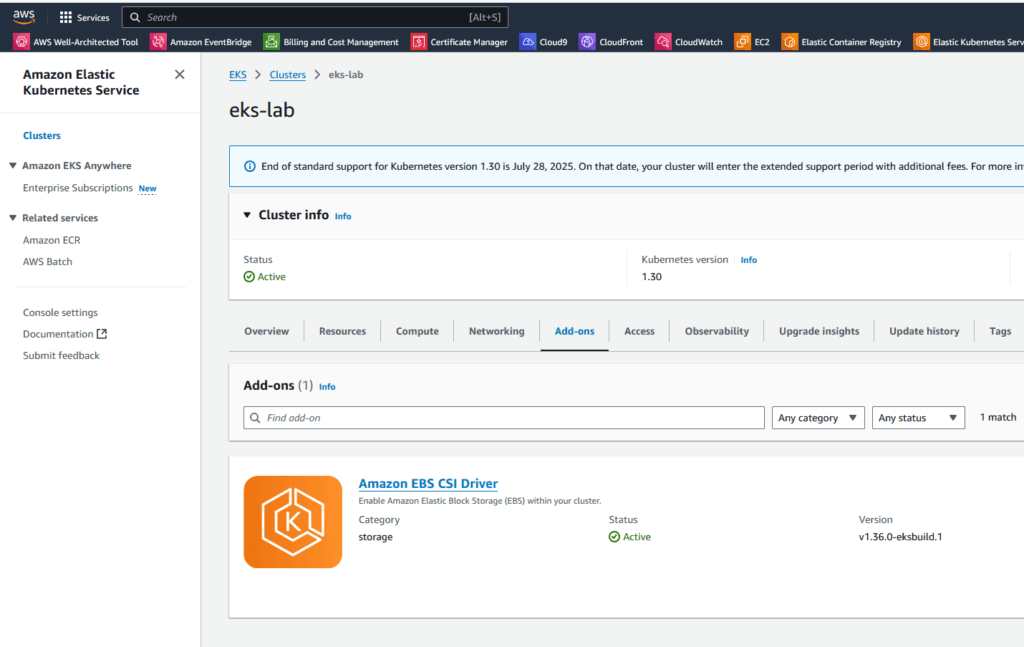
EKS Blueprint supports several addons that are crucial to the operation of the cluster:
module "kubernetes_addons" {
  source = "github.com/aws-ia/terraform-aws-eks-blueprints?ref=v4.32.1/modules/kubernetes-addons"

  eks_cluster_id = module.eks_blueprints.eks_cluster_id

  # Addons Essenciais
  enable_amazon_eks_vpc_cni    = true
  enable_amazon_eks_coredns    = true
  enable_amazon_eks_kube_proxy = true

  # Addons de Monitoramento
  enable_aws_load_balancer_controller = true
  enable_metrics_server              = true
  enable_aws_cloudwatch_metrics      = true
  enable_kube_prometheus_stack       = true

  # Addons de Storage
  enable_aws_ebs_csi_driver = true

  # Addons de Segurança
  enable_cert_manager = true
  enable_external_dns = true

  depends_on = [
    module.eks_blueprints
  ]
}
For our project, we used the configuration below for the block dealing with Addons:
module "kubernetes_addons" {
  source = "github.com/aws-ia/terraform-aws-eks-blueprints?ref=v4.32.1/modules/kubernetes-addons"

  eks_cluster_id = module.eks_blueprints.eks_cluster_id

  enable_aws_load_balancer_controller  = true
  enable_amazon_eks_aws_ebs_csi_driver = true
  enable_metrics_server                = true
  enable_kube_prometheus_stack         = true # (Opcional) O namespace para instalar a release.

  kube_prometheus_stack_helm_config = {
    name = "kube-prometheus-stack" # (Obrigatório) Nome da release.
    #repository = "https://prometheus-community.github.io/helm-charts" # (Opcional) URL do repositório onde localizar o chart solicitado.
    chart     = "kube-prometheus-stack" # (Obrigatório) Nome do chart a ser instalado.
    namespace = "kube-prometheus-stack" # (Opcional) O namespace para instalar a release.
    values = [templatefile("${path.module}/values-stack.yaml", {
      operating_system = "linux"
    })]
  }

  depends_on = [
    module.eks_blueprints
  ]
}To avoid problems during installation, in some cases timeout adjustments may be necessary so that all resources are provisioned as expected:
timeouts {
  create = "30m"
  delete = "30m"
}

helm_config = {
  timeout = 1800  # 30 minutes
  retry   = 2
}# List installed addons
kubectl get pods -A | grep -E 'aws-load-balancer|metrics-server|prometheus'
# Check installation status
kubectl get deployments -A
# Check logs
kubectl logs -n kube-system -l app=aws-load-balancer-controllerTo destroy the EKS cluster with Addons, the procedure is exactly the same as for the “ordinary” EKS with Blueprint, just run the make destroy command and wait for the commands to be executed:
make destroyThe difference here is that Terraform will remove the installed addons, ensuring that dependencies related to the EKS cluster, such as AWS Load Balancer Controller, EBS CSI DRIVER, Prometheus, Grafana and Metrics Server, are removed before deleting the EKS cluster.
EKS Blueprint is a great option for provisioning and configuring Kubernetes clusters on AWS quickly and efficiently. With Grafana integration, you can monitor your cluster in real time and guarantee the availability and performance of your applications. In addition, EKS Blueprint provides support for addons, allowing you to extend the functionality of the cluster according to your needs. However, it’s important to bear in mind the particularities and pros and cons of EKS Blueprint before you start using it in production.
If the goal is to manage an AWS-native, scalable and standardized environment, EKS Blueprints is a solid choice. For local tests where there is no need for communication or integration with AWS resources, go for Minikube, and if you need complete control, opt for a common Terraform module. The decision depends directly on the balance between simplicity, flexibility and scalability required for your project.
Cover image by gstudioimagen on Freepik