DevOps Mind
Monitorando clusters Kubernetes: Revisão para a Prova CKA
Se você está se preparando para a prova CKA (Certified Kubernetes Administrator), sabe que monitorar recursos do cluster é uma habilidade crítica. Venho estudando Kubernetes há alguns anos, e posso garantir que dominar o monitoramento pode fazer toda a diferença na sua jornada.
Neste artigo, vou compartilhar minha experiência e estratégias para monitorar eficientemente clusters Kubernetes, focando nos aspectos cobrados na prova CKA para o item “Monitor cluster and application resource usage“. Vamos verificar os comandos, ferramentas e práticas que podem ajudar na sua compreensão sobre monitoramento de recursos no Kubernetes.

Tópicos
Explorando o monitoramento no Kubernetes
Por que o monitoramento é importante?
O Kubernetes é projetado para gerenciar aplicações distribuídas e dinâmicas. Isso significa que problemas como pods sobrecarregados, nodes subutilizados ou aplicações com leaks de memória podem acontecer sem aviso. O monitoramento:
- Ajuda a identificar gargalos de performance.
- Permite tomar ações preventivas antes que algo afete seus usuários.
- Certificar de que os recursos sejam utilizados de maneira eficaz.
No exame CKA, você precisa demonstrar conhecimento prático sobre ferramentas e métricas. Vamos ver como.
Monitorando clusters Kubernetes – Ferramentas nativas
Uma das vantagens do Kubernetes é que ele oferece ferramentas integradas para monitorar recursos. Aqui estão as mais importantes:
1. kubectl top
O comando kubectl top é essencial para monitorar o uso de CPU e memória em tempo real. Ele funciona em conjunto com o Metrics Server, que coleta essas métricas no cluster.
Na minha rotina, uso constantemente este comando para verificações rápidas.
Exemplo:
Para monitorar os recursos dos nodes:
kubectl top nodesResultado esperado:
NAME    CPU(cores)   CPU%   MEMORY(bytes)   MEMORY%
node-1  500m         25%    2Gi             50%
node-2  250m         12%    1Gi             25%
Para visualizar o uso de recursos dos pods:
kubectl top podsDica para o exame:
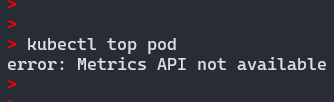
Certifique-se de que o Metrics Server está instalado antes de usar kubectl top. Você pode verificar isso com:
kubectl get deployment -n kube-system metrics-server<br>Caso contrário, você pode receber uma mensagem de erro error: Metrics API not available, semelhante à imagem abaixo:
Instalando o Metrics Server
Para que o kubectl top funcione, é necessário instalar o Metrics Server. Aqui está como fazer:
# Instalação do Metrics Server
kubectl apply -f https://github.com/kubernetes-sigs/metrics-server/releases/latest/download/components.yaml
São instalados diversos componentes necessários para o funcionamento do Metrics Server:

Com isto já deve ser possível verificar o consumo dos recursos via comando kubectl top.
No meu laboratório eu encontrei alguns problemas com o manifesto acima para subir o Metrics Server, os Pods não ficavam Ready:

Investigando os logs, notei erros nos Pods do Metrics Server:
Readiness probe failed: HTTP probe failed with statuscode: 500


I0125 17:59:00.032698       1 server.go:191] "Failed probe" probe="metric-storage-ready" err="no metrics to serve"
E0125 17:59:07.184763       1 scraper.go:149] "Failed to scrape node" err="Get \"https://192.168.0.104:10250/metrics/resource\": tls: failed to verify certificate: x509: cannot validate certificate for 192.168.0.104 because it doesn't contain any IP SANs" node="wsl2"
I0125 17:59:10.033275       1 server.go:191] "Failed probe" probe="metric-storage-ready" err="no metrics to serve"
I0125 17:59:20.035244       1 server.go:191] "Failed probe" probe="metric-storage-ready" err="no metrics to serve"
E0125 17:59:22.185345       1 scraper.go:149] "Failed to scrape node" err="Get \"https://192.168.0.104:10250/metrics/resource\": tls: failed to verify certificate: x509: cannot validate certificate for 192.168.0.104 because it doesn't contain any IP SANs" node="wsl2"
I0125 17:59:30.033193       1 server.go:191] "Failed probe" probe="metric-storage-ready" err="no metrics to serve"
I0125 17:59:36.919835       1 server.go:191] "Failed probe" probe="metric-storage-ready" err="no metrics to serve"
E0125 17:59:37.184158       1 scraper.go:149] "Failed to scrape node" err="Get \"https://192.168.0.104:10250/metrics/resource\": tls: failed to verify certificate: x509: cannot validate certificate for 192.168.0.104 because it doesn't contain any IP SANs" node="wsl2"
I0125 17:59:40.033405       1 server.go:191] "Failed probe" probe="metric-storage-ready" err="no metrics to serve"
Eu consegui corrigir os erros e consertar os Pods utilizando este manifesto YAML para subir o Metrics Server:
apiVersion: v1
kind: ServiceAccount
metadata:
  labels:
    k8s-app: metrics-server
  name: metrics-server
  namespace: kube-system
---
apiVersion: rbac.authorization.k8s.io/v1
kind: ClusterRole
metadata:
  labels:
    k8s-app: metrics-server
    rbac.authorization.k8s.io/aggregate-to-admin: "true"
    rbac.authorization.k8s.io/aggregate-to-edit: "true"
    rbac.authorization.k8s.io/aggregate-to-view: "true"
  name: system:aggregated-metrics-reader
rules:
- apiGroups:
  - metrics.k8s.io
  resources:
  - pods
  - nodes
  verbs:
  - get
  - list
  - watch
---
apiVersion: rbac.authorization.k8s.io/v1
kind: ClusterRole
metadata:
  labels:
    k8s-app: metrics-server
  name: system:metrics-server
rules:
- apiGroups:
  - ""
  resources:
  - nodes/metrics
  verbs:
  - get
- apiGroups:
  - ""
  resources:
  - pods
  - nodes
  verbs:
  - get
  - list
  - watch
---
apiVersion: rbac.authorization.k8s.io/v1
kind: RoleBinding
metadata:
  labels:
    k8s-app: metrics-server
  name: metrics-server-auth-reader
  namespace: kube-system
roleRef:
  apiGroup: rbac.authorization.k8s.io
  kind: Role
  name: extension-apiserver-authentication-reader
subjects:
- kind: ServiceAccount
  name: metrics-server
  namespace: kube-system
---
apiVersion: rbac.authorization.k8s.io/v1
kind: ClusterRoleBinding
metadata:
  labels:
    k8s-app: metrics-server
  name: metrics-server:system:auth-delegator
roleRef:
  apiGroup: rbac.authorization.k8s.io
  kind: ClusterRole
  name: system:auth-delegator
subjects:
- kind: ServiceAccount
  name: metrics-server
  namespace: kube-system
---
apiVersion: rbac.authorization.k8s.io/v1
kind: ClusterRoleBinding
metadata:
  labels:
    k8s-app: metrics-server
  name: system:metrics-server
roleRef:
  apiGroup: rbac.authorization.k8s.io
  kind: ClusterRole
  name: system:metrics-server
subjects:
- kind: ServiceAccount
  name: metrics-server
  namespace: kube-system
---
apiVersion: v1
kind: Service
metadata:
  labels:
    k8s-app: metrics-server
  name: metrics-server
  namespace: kube-system
spec:
  ports:
  - name: https
    port: 443
    protocol: TCP
    targetPort: https
  selector:
    k8s-app: metrics-server
---
apiVersion: apps/v1
kind: Deployment
metadata:
  labels:
    k8s-app: metrics-server
  name: metrics-server
  namespace: kube-system
spec:
  selector:
    matchLabels:
      k8s-app: metrics-server
  strategy:
    rollingUpdate:
      maxUnavailable: 0
  template:
    metadata:
      labels:
        k8s-app: metrics-server
    spec:
      containers:
      - args:
        - --cert-dir=/tmp
        - --secure-port=4443
        - --kubelet-preferred-address-types=InternalIP,ExternalIP,Hostname
        - --kubelet-use-node-status-port
        - --metric-resolution=15s
        - --kubelet-insecure-tls
        image: registry.k8s.io/metrics-server/metrics-server:v0.6.3
        imagePullPolicy: IfNotPresent
        livenessProbe:
          failureThreshold: 3
          httpGet:
            path: /livez
            port: https
            scheme: HTTPS
          periodSeconds: 10
        name: metrics-server
        ports:
        - containerPort: 4443
          name: https
          protocol: TCP
        readinessProbe:
          failureThreshold: 3
          httpGet:
            path: /readyz
            port: https
            scheme: HTTPS
          initialDelaySeconds: 20
          periodSeconds: 10
        resources:
          requests:
            cpu: 100m
            memory: 200Mi
        securityContext:
          allowPrivilegeEscalation: false
          readOnlyRootFilesystem: true
          runAsNonRoot: true
          runAsUser: 1000
        volumeMounts:
        - mountPath: /tmp
          name: tmp-dir
      nodeSelector:
        kubernetes.io/os: linux
      priorityClassName: system-cluster-critical
      serviceAccountName: metrics-server
      volumes:
      - emptyDir: {}
        name: tmp-dir
---
apiVersion: apiregistration.k8s.io/v1
kind: APIService
metadata:
  labels:
    k8s-app: metrics-server
  name: v1beta1.metrics.k8s.io
spec:
  group: metrics.k8s.io
  groupPriorityMinimum: 100
  insecureSkipTLSVerify: true
  service:
    name: metrics-server
    namespace: kube-system
  version: v1beta1
  versionPriority: 100
Corrigido com esta especificação para o Container, ajustando:
- atualizada a porta segura para
--secure-port=4443 - ajustada a porta do container para
containerPort: 4443 - adicionado o arg
--kubelet-insecure-tls
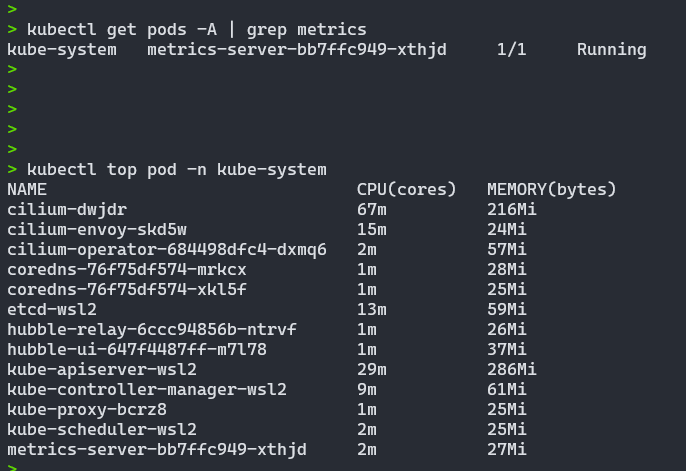
Então o Pod do Metrics Server subiu normalmente e foi possível obter as métricas dos Pods utilizando o comando kubectl top pod -n kube-system, por exemplo:
2. Logs e Eventos
Outra forma de monitorar o cluster é analisar logs e eventos. Aqui estão os comandos mais úteis:
- Logs de um pod:
kubectl logs <nome-do-pod> - Eventos do cluster:
kubectl get events - Descrição detalhada de um pod:
kubectl describe pod <nome-do-pod>
Esses comandos ajudam a identificar problemas específicos, como pods que estão reiniciando ou não conseguem acessar recursos.
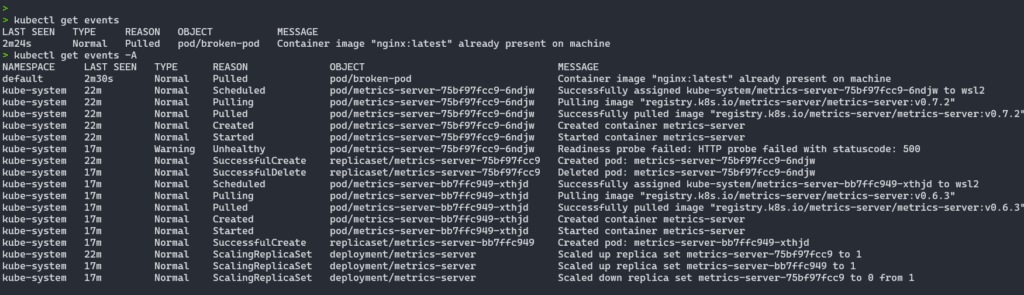
Utilizando o comando kubectl get events, podemos pegar eventos de recursos variados, ajudando demais no Troubleshooting.
Ponto de atenção
Pode ser necessário informar o Namespace utilizando o parametro -n, para trazer todos os eventos desejados. Neste caso eu utilizei o -A que retorna todos os Namespaces:
Configurando Recursos de Pods
O Kubernetes permite definir requests e limits para controlar o uso de CPU e memória dos pods. Isso é fundamental para garantir que os recursos sejam alocados de forma justa e evitar problemas de performance.
Exemplo de YAML:
apiVersion: v1
kind: Pod
metadata:
  name: exemplo-pod
spec:
  containers:
  - name: exemplo-container
    image: nginx
    resources:
      requests:
        memory: "64Mi"
        cpu: "250m"
      limits:
        memory: "128Mi"
        cpu: "500m"
- CPU: Expressa em milicores (ex.:
250msignifica 25% de 1 core). - Memória: Definida em valores como
Mi(mebibytes) ouGi(gibibytes).
O que são Requests e Limits?
- Requests: Quantidade mínima de recursos garantida para o pod.
- Limits: Limite máximo que o pod pode consumir.
Comportamentos com Requests e Limits
- Uso de CPU:
- Se um contêiner ultrapassar o limite de CPU, ele não será encerrado, mas será estrangulado (throttled).
- Isso significa que ele não poderá usar mais do que o limite configurado.
- Uso de Memória:
- Se o uso de memória exceder o limite, o contêiner será encerrado com um erro de OOMKilled (Out of Memory).
- Sem Requests e Limits:
- O Kubernetes permite que o contêiner use recursos ilimitados (dentro da capacidade do nó), mas isso pode causar instabilidade no cluster.
Dicas para o exame:
Verifique o Pod ofensor
- No CKA, você pode precisar identificar um pod que está consumindo mais recursos do que o definido nos limits. Use
kubectl describe podpara verificar isso.
Sempre configure requests e limits nos contêineres:
- Durante a prova, verifique a documentação oficial do Kubernetes para valores padrão, se necessário.
Priorize Pods críticos com requests:
- Defina requests para workloads prioritários garantindo que tenham os recursos mínimos necessários.
Teste o comportamento em laboratório:
- Simule cenários onde um Pod consome mais recursos do que o permitido para entender o comportamento de throttling e OOMKilled.
Monitore as métricas:
- Utilize ferramentas como o Prometheus e Grafana para verificar o consumo real de recursos dos contêineres.
O correto uso de requests e limits não é apenas essencial para manter a estabilidade de um cluster Kubernetes, mas também é um tópico crítico para a Prova CKA. Durante seus estudos, pratique a configuração e a verificação de recursos para ganhar confiança no exame.
Ferramentas Avançadas
Apesar que o exame CKA foque no básico, é bom conhecer algumas ferramentas mais robustas. Elas podem não ser exigidas, mas ajudam a compreender melhor o funcionamento do cluster.
Prometheus e Grafana
Embora os comandos nativos sejam úteis, para um monitoramento mais profundo, recomendo ferramentas como Prometheus e Grafana. Na minha experiência, essas ferramentas oferecem insights visuais poderosos.
- Prometheus: Coleta métricas detalhadas do cluster.
- Grafana: Cria dashboards para visualização dessas métricas.
Exemplo de alerta no Prometheus:
Um alerta simples para CPU alta:
- alert: HighCPUUsage
  expr: sum(rate(container_cpu_usage_seconds_total[5m])) by (pod) > 0.8
  for: 1m
  labels:
    severity: warning
  annotations:
    summary: "Uso de CPU acima de 80% no pod {{ $labels.pod }}"
Kube-state-metrics
Essa ferramenta fornece informações detalhadas sobre o estado dos objetos do Kubernetes, como Deployments, Pods e Nodes.
OpenLens: Gerenciador visual para Kubernetes
O OpenLens é uma poderosa ferramenta open-source que facilita o gerenciamento de clusters Kubernetes através de uma interface gráfica. Construído sobre a base do popular Lens, o OpenLens se destaca por ser uma versão mais aberta e flexível, permitindo que você explore todo o potencial do Kubernetes sem limitações de licenciamento.
Essa ferramenta é especialmente útil para administradores que desejam uma visão clara e intuitiva dos recursos de seus clusters, incluindo pods, serviços, deployments, métricas de CPU e memória, além de insights detalhados sobre eventos e logs. O OpenLens torna possível monitorar a saúde do cluster e analisar problemas com mais eficiência, usando uma interface gráfica altamente interativa.
Através da interface dele é possível entender sobre o consumo de RAM, CPU, Rede e outros elementos importantes para o monitoramento de Clusters Kubernetes:

Entre os principais recursos do OpenLens, destacam-se:
- Visualização em tempo real de métricas: Permite monitorar a utilização de recursos diretamente no painel.
- Gerenciamento multi-cluster: Ideal para quem trabalha com vários clusters simultaneamente.
- Suporte a extensões personalizadas: Você pode adicionar extensões para adaptar o OpenLens às suas necessidades específicas.
Na prática, o OpenLens simplifica tarefas que, via linha de comando, poderiam ser mais trabalhosas, como navegar por namespaces ou inspecionar logs de pods específicos. Ele é uma excelente opção para quem está estudando para o CKA, pois oferece um ambiente visual que complementa o aprendizado com o kubectl e outras ferramentas CLI.
Se você busca uma forma mais intuitiva de explorar e gerenciar seus clusters, o OpenLens pode ser uma adição indispensável ao seu conjunto de ferramentas avançadas.
Dica para o exame:
Foque no uso de kubectl e nas ferramentas nativas, mas tenha uma ideia básica dessas integrações para expandir seu conhecimento.
Casos Práticos
Vamos imaginar um cenário comum que você pode encontrar na prova:
Problema: Um pod está sendo reiniciado constantemente.
Passos para resolver:
- Verifique o status do pod:
kubectl get pod <nome-do-pod> - Analise os logs:
kubectl logs <nome-do-pod> - Cheque os eventos:
kubectl describe pod <nome-do-pod> - Identifique se há limites de recursos sendo excedidos.
Com essas informações, você pode tomar ações como aumentar os limits ou ajustar o código da aplicação.
Conclusão
Monitorar o uso de recursos no Kubernetes é uma habilidade essencial para passar na prova CKA e também para sua carreira. Ferramentas como kubectl top, kubectl describe e a configuração de requests e limits são importantes ao atuar contra problemas de performance.
Lembre-se: pratique em um ambiente de teste. Quanto mais você explorar essas ferramentas, mais confiante estará na prova. E se precisar de mais dicas ou ajuda, fique à vontade para entrar em contato comigo ou deixar um comentário aqui!
Siga revisando os conteúdos para a Prova CKA, confira este post onde revisamos a parte sobre o ETCD: